
The Problem
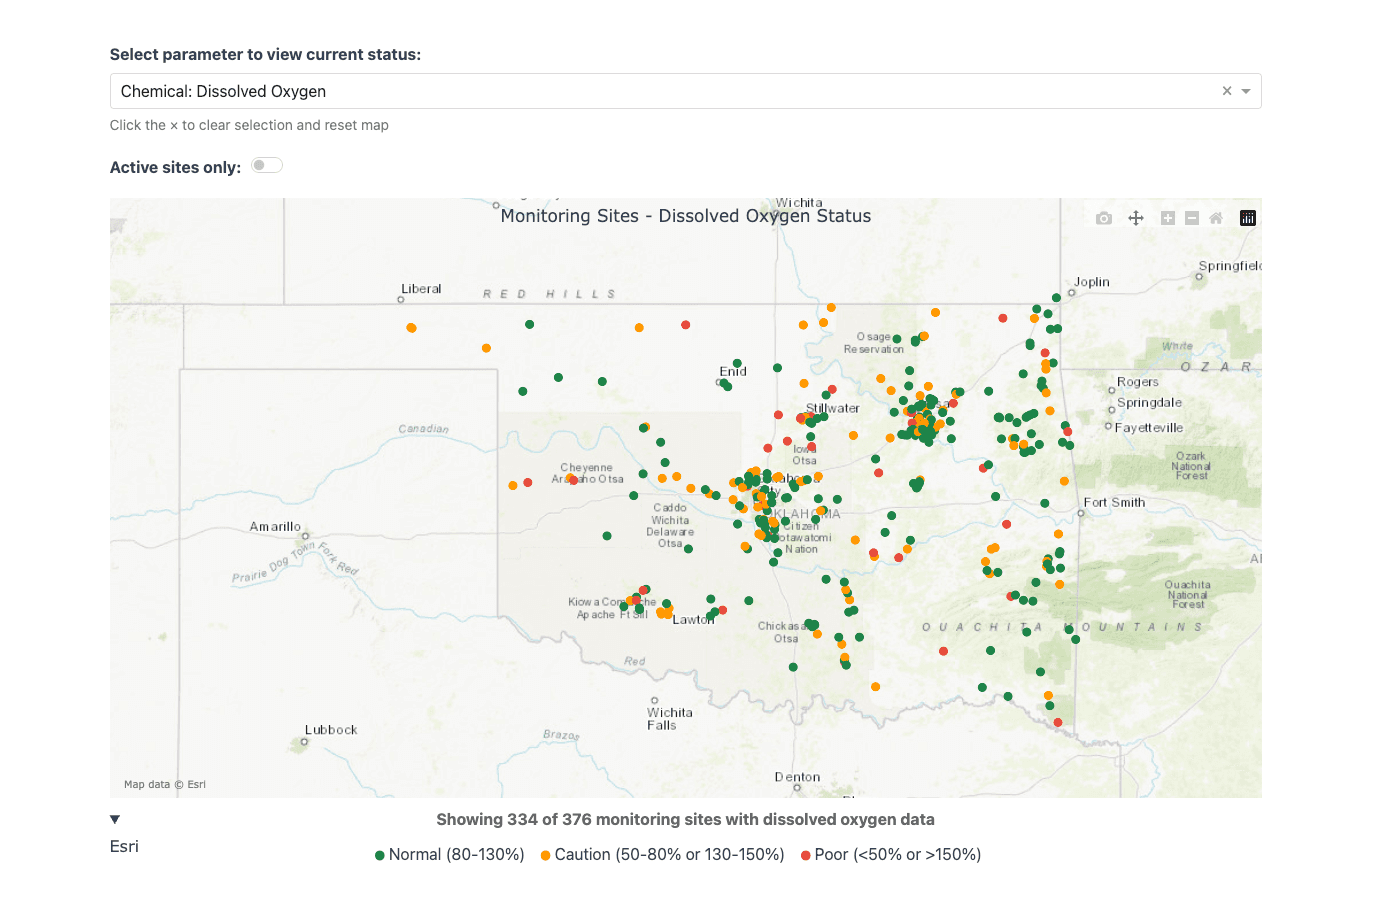
Since 1992, Blue Thumb volunteers have monitored water quality at 370+ stream locations across Oklahoma. Three decades of high-quality data had piled up, but it was scattered across agency portals, spreadsheets, and an ArcGIS server. The data was split across four different categories: water chemistry, fish surveys, macroinvertebrate surveys, and habitat assessments. Here is how I pulled all of it into one live, continuously updated map for public viewing.
Unifying four data streams
Four data sources, each with a distinct shape, had to land in a single normalized schema where a fish survey and a nitrate reading could be linked to the same monitoring location.
Chemistry data mixed range-based measurements, competing nutrient columns, and below-detection-limit values written as text. Fish and macroinvertebrate surveys arrived as bioassessment scores that needed their own indexing logic. Habitat assessments were a different shape again. I wrote a dedicated processing module per domain to clean, validate, and reshape each source, then collapse all four into one schema keyed on a shared set of sites.
blue_thumb.db- One module per domain — chemical, fish, macroinvertebrate, and habitat data each get their own load-clean-normalize path, so each domain's quirks stay isolated.
- Below-detection-limit handling — non-numeric "<0.01"-style readings are converted to consistent numeric values instead of being dropped.
- Reproducible build — the whole database rebuilds from the raw files with a single command, so the pipeline is repeatable rather than a one-time hand-clean.
- Validated before insert — every domain runs through QAQC gating and duplicate detection before a row is written.
One canonical map of sites
Unifying the measurements only works if every reading can be tied to the right physical place, and volunteer submissions do not carry clean IDs. The same creek shows up under different spellings and slightly different coordinates across all four data sources. So the spine of the whole database is one canonical site table, built before any measurement is loaded.
Building it runs in three passes. First I consolidated the site lists out of every source into one master list, using a priority ladder to settle conflicts when two sources disagree on a site's county, basin, or coordinates. Next I merged coordinate-duplicates: sites within 50 meters of each other are clustered with Haversine distance and folded into a single record, with all their monitoring data carried over. Only then are the master sites loaded, each classified as active or historic by how recent its chemistry is.
With that table in place, every incoming record resolves against it through a four-step ladder.
Daily incremental sync
Once the historical database existed, the last piece was keeping it current. New chemical readings land in an ArcGIS Feature Service. A scheduled job pulls the new records once a day from the REST API, runs them through the chemical and site-resolution validation pipeline, then writes an updated copy of the database to cloud storage. An always-on Cloud Run app reads that file and serves it. The two stay decoupled, sharing nothing but the database, so a failed sync can just retry without affecting what visitors see.
blue_thumb.dbKey design decisions:
- Incremental sync — the daily job uses an
EditDatewatermark to fetch only the records that changed since the last run, not the entire dataset. - Idempotent inserts — re-running the job never creates duplicates, so a retry is always safe.
- QAQC gating — validation, below-detection-limit conversion, and duplicate detection all run before anything is written.
- Backed up before every write — the previous database is versioned to cloud storage ahead of each update.
In production
The dashboard runs live on Cloud Run, refreshes automatically every day, and is backed by 800+ automated tests across the data-processing pipeline. A Vertex AI chatbot grounded in Blue Thumb's own documentation for context answers visitor questions about stream health. I continue to maintain and extend the dashboard alongside fellow Blue Thumb volunteer Miguel Ingram.